Why Build a Survey Tool
Commercial WiFi survey software starts around a thousand dollars per seat and assumes you are surveying a campus. For a warehouse, a clinic, or a two-storey office, you need far less: a floor plan, a way to record signal strength where you are standing, and a picture at the end that shows management where the dead zones are.
That is a weekend project. This guide builds one in C# — reading real RSSI from the Windows Native WiFi API, sampling by clicking a floor plan, and interpolating a coverage heatmap between the points you measured.
The finished reference implementation is WifiSurvey on GitHub.
Project Overview
What you'll build:
- A floor-plan canvas with pan, zoom, and click-to-sample
- Live RSSI, link quality, channel, frequency, and band capture
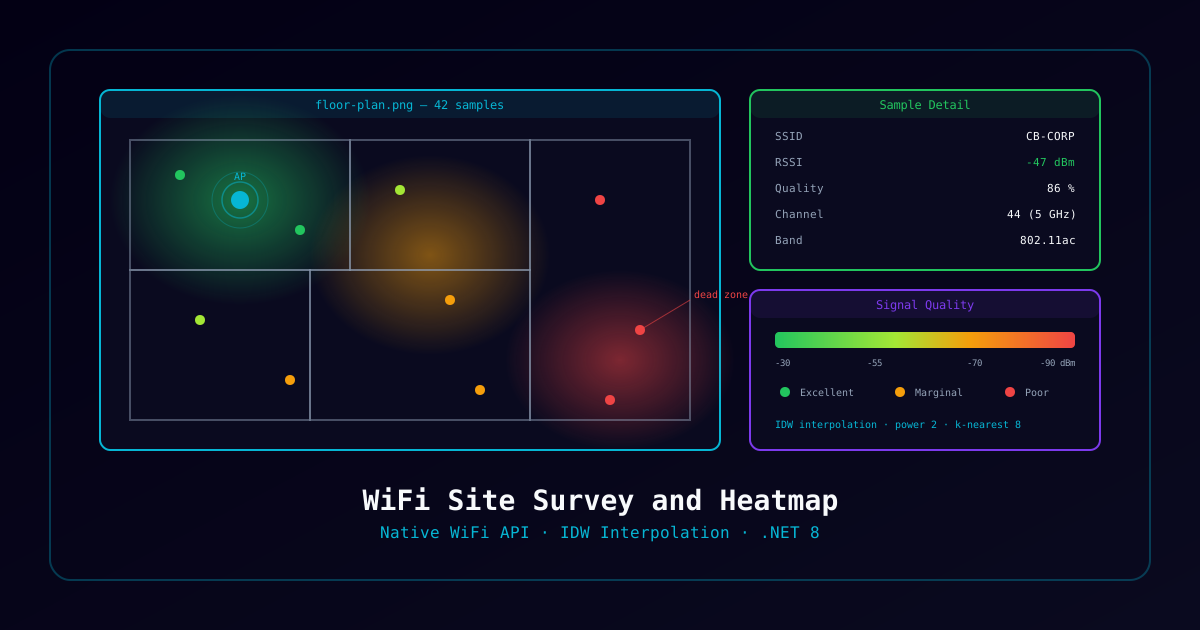
- An IDW-interpolated heatmap that fills the space between samples
- Saveable survey projects and CSV / image / HTML export
Time to complete: 6-8 hours
Prerequisites: Solid C#, comfort with P/Invoke, and a Windows 10/11 machine with a WiFi adapter. This one genuinely needs real hardware — you cannot fake a survey in a VM without a passthrough adapter.
Step 1: Talk to the Native WiFi API
.NET has no managed WiFi API. You call wlanapi.dll directly. Three functions do almost everything:
[DllImport("wlanapi.dll")]
private static extern uint WlanOpenHandle(
    uint dwClientVersion, IntPtr pReserved,
    out uint pdwNegotiatedVersion, out IntPtr phClientHandle);

[DllImport("wlanapi.dll")]
private static extern uint WlanEnumInterfaces(
    IntPtr hClientHandle, IntPtr pReserved, out IntPtr ppInterfaceList);

[DllImport("wlanapi.dll")]
private static extern uint WlanGetAvailableNetworkList(
    IntPtr hClientHandle, ref Guid pInterfaceGuid,
uint dwFlags, IntPtr pReserved, out IntPtr ppAvailableNetworkList);Every one of these allocates unmanaged memory you are responsible for. Wrap the handle in a SafeHandle and free every list with WlanFreeMemory, or a long survey will leak steadily as you sample.
public sealed class WlanClient : IDisposable
{
    private readonly IntPtr _handle;

    public WlanClient()
    {
        if (WlanOpenHandle(2, IntPtr.Zero, out _, out _handle) != 0)
            throw new InvalidOperationException("WlanOpenHandle failed");
    }

    public void Dispose() => WlanCloseHandle(_handle, IntPtr.Zero);
}Step 2: Signal Quality Is Not dBm
This is the detail that trips up most first attempts. The Native WiFi API reports wlanSignalQuality as an integer from 0 to 100. That is not RSSI — it is a linear scale across a fixed dBm window, and Microsoft documents the mapping:
// wlanSignalQuality 0   => -100 dBm
// wlanSignalQuality 100 =>  -50 dBm
public static int QualityToDbm(uint signalQuality)
=> (int)(signalQuality / 2.0) - 100;Two consequences worth internalising before you trust your own data:
- Resolution is 0.5 dBm per quality point. You cannot distinguish -47 from -47.3 dBm; do not render a heatmap that implies you can.
- The scale saturates. Anything stronger than -50 dBm reads as 100, and anything weaker than -100 dBm reads as 0. Standing next to the AP, every sample looks identical — which is fine, because that is not where coverage problems live.
Step 3: The Floor Plan Canvas
Load any bitmap as the backdrop and keep a transform between screen space and image space. Do not store sample positions in screen coordinates — the moment someone zooms, every point you recorded is wrong.
private float _zoom = 1.0f;
private PointF _pan = PointF.Empty;

private PointF ScreenToImage(Point screen) => new(
    (screen.X - _pan.X) / _zoom,
    (screen.Y - _pan.Y) / _zoom);

protected override void OnMouseClick(MouseEventArgs e)
{
    if (e.Button != MouseButtons.Left) return;
    var imagePoint = ScreenToImage(e.Location);
    var reading = _wlan.SampleCurrent();
    _survey.Add(new Measurement(imagePoint, reading));
    Invalidate();
}Store measurements in image coordinates, render them through the transform. Pan on right-drag, zoom on the mouse wheel around the cursor position.
Step 4: Interpolate the Heatmap
You have scattered points and need a continuous surface. Inverse Distance Weighting is the right tool here — simple, no fitting step, and it honours your measurements exactly.
Each output pixel is a weighted average of nearby samples, where weight falls off with the square of distance:
public static double Interpolate(PointF target, IReadOnlyList<Measurement> samples, int k = 8)
{
    const double Power = 2.0;

    var nearest = samples
        .Select(s => (s, dist: Distance(target, s.Position)))
        .OrderBy(t => t.dist)
        .Take(k)
        .ToList();

    // Standing exactly on a sample: return it, and avoid dividing by zero
    if (nearest[0].dist < 0.0001) return nearest[0].s.Rssi;

    double weightedSum = 0, weightTotal = 0;
    foreach (var (s, dist) in nearest)
    {
        double w = 1.0 / Math.Pow(dist, Power);
        weightedSum += w * s.Rssi;
        weightTotal += w;
    }

    return weightedSum / weightTotal;
}Three practical notes:
- Limit to the k nearest samples. Weighting every point against every pixel is O(pixels × samples) and will crawl on a large floor plan. Eight neighbours is plenty.
- Guard the zero-distance case. Without that early return, a pixel landing exactly on a sample divides by zero.
- IDW cannot see walls. It will happily interpolate strong signal straight through a lift shaft. Sample densely near anything that attenuates, and treat the space between rooms as an estimate rather than a measurement.
Step 5: Map Values to Colour
Interpolate on a green-to-red ramp so the picture reads instantly. Anchor the ends at values that mean something operationally rather than at your dataset's min and max — otherwise a survey of a uniformly good floor renders alarming red patches.
| Range | Quality | Colour |
|---|---|---|
| -30 to -50 dBm | Excellent | Green |
| -50 to -60 dBm | Good | Yellow-green |
| -60 to -70 dBm | Marginal | Amber |
| -70 to -90 dBm | Poor | Red |
Anything weaker than -70 dBm is where voice and roaming start to suffer, so that is the boundary worth making visually obvious.
Render the heatmap to an off-screen bitmap once after each sample, then blit it under the markers. Recomputing interpolation inside OnPaint will make panning unusable.
Step 6: Export Something You Can Send
The survey is only useful if it leaves your laptop. Three formats cover nearly every request:
- CSV — one row per sample: position, RSSI, quality, SSID, BSSID, channel, band, timestamp. This is what goes into a spreadsheet when someone wants to argue about coverage.
- PNG — the composited floor plan plus heatmap plus legend. This is what goes into the report.
- HTML — both of the above in one self-contained file you can email.
Keep the project file itself boring. Serialise the sample list and the floor-plan path to JSON under your own extension:
var json = JsonSerializer.Serialize(_survey, new JsonSerializerOptions
{
    WriteIndented = true
});
File.WriteAllText(path, json);Embedding the floor-plan image as base64 makes the project file self-contained and much easier to hand to a colleague — at the cost of size. Worth it.
Surveying Well
The tool is the easy half. Getting data worth trusting:
- Walk a grid, not a path. Sample every 5 to 10 metres in open space, tighter near walls and lifts.
- Hold still and let it settle. Signal quality fluctuates; sample after a second of standing, not mid-stride.
- Survey at working height. A reading taken at floor level is not what a laptop on a desk sees.
- Repeat the worst areas at a different time of day. Interference from microwaves, neighbouring networks, and simple occupancy moves the numbers more than people expect.
Where to Take It Next
- Multi-AP attribution — record BSSID per sample and colour by which AP is serving, which exposes roaming problems a pure signal map hides
- Channel overlap — chart co-channel interference from the available network list
- Predictive mode — place APs on the plan and model expected coverage before buying hardware
- 5 GHz versus 6 GHz overlays — same walk, two surfaces, side by side
Reference Implementation
Complete source, including the WinForms canvas, the P/Invoke layer, and the export pipeline, is at CosmicBytez/WifiSurvey. MIT licensed.